Creating Art With Code
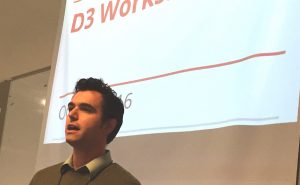
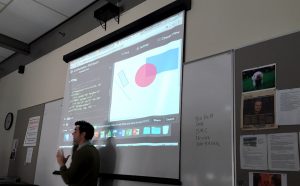
Randolph Jones, who works at OSF, and is also an Adjunct Professor in the eMDA Department, conducted a most entertaining hands-on Tech Workshop on Data Visualization last Thursday.
He began the workshop by introducing the D3 Library [D3 = Data Driven Documents]; a JavaScript Library that runs within a web browser, and offers a method to take arrays of data and combine the elements with visuals to display Scalable Vector Graphics (SVGs).
He displayed an example from the New York Times (NYT) Website that showed a map of the 2016 Electoral College results, based upon recent polls.

He then showed us an embedded job opportunity post within the page. Cool.
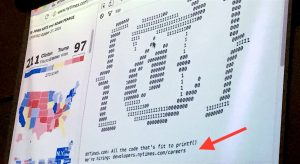
Job opportunity advertisement; embedded in image of Electoral Map. Copyright © 2016, FPP, Inc. All rights reserved.
He introduced Codepen, a Swift-like “playground” in which to play with your code. The Codepen play space is segmented into views for html, css and javaScript code, so you are able to readily see the results of your code—and changes to that code.
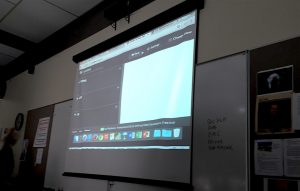
Codepen workspace. Copyright © 2016, FPP, Inc. All rights reserved.
The most fun for the audience was being able to play with the example shapes Randolph had previously created—to change the colors, sizes and locations, within the Codepen workspace.
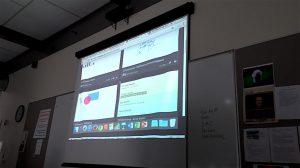
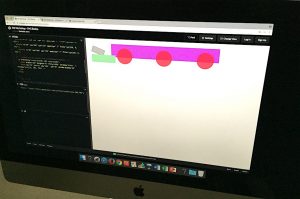
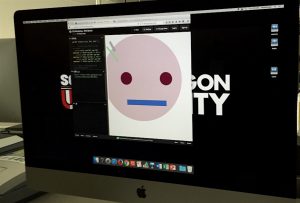
Scalable Vector Graphics (SVG) is “an XML-based vector image format for two-dimensional graphics with support for interactivity and animation.” Basic shapes we played with included rectangles, lines and circles.
Then he turned us loose to play. Priscilla replicated the circle and extended the sizes of other shapes to produce a train.
Katie replicated and enlarged the circle to produce a happy face; she’s still working on changing the rectangle into a smile.
This workshop was, without a doubt, the most informative and helpful workshop we’ve had at Tech Workshops at SOU. The examples and demonstrations took us from very basic html, css and javascript through using the tools provided by D3 to a fun end result.
Thanks, Randolph!
Watch a video of the Data Visualization Tech Workshop at YouTube.
Link to the collection of examples that Randolph presented during his workshop.
And, for those of you who have an interest in diving deeper into the material, here’s another link.
Author: Karen
Written: 10/30/16
Published: 10/31/16
Copyright © 2016, FPP, Inc. All rights reserved.